

Using Google Analytics for Product Development 🧐
Using Google Analytics for Product Development 🧐
S1E1 | Behind the Product with Morgan


In Episode 1 of Season 1, Prakash goes through his journey building Xano, a comprehensive platform that allows entrepreneurs and businesses to build scalable backends for apps - with no code.
One of the takeaways from the episode was to use data where you can find it, to fuel your product development strategies, like with Google analytics!
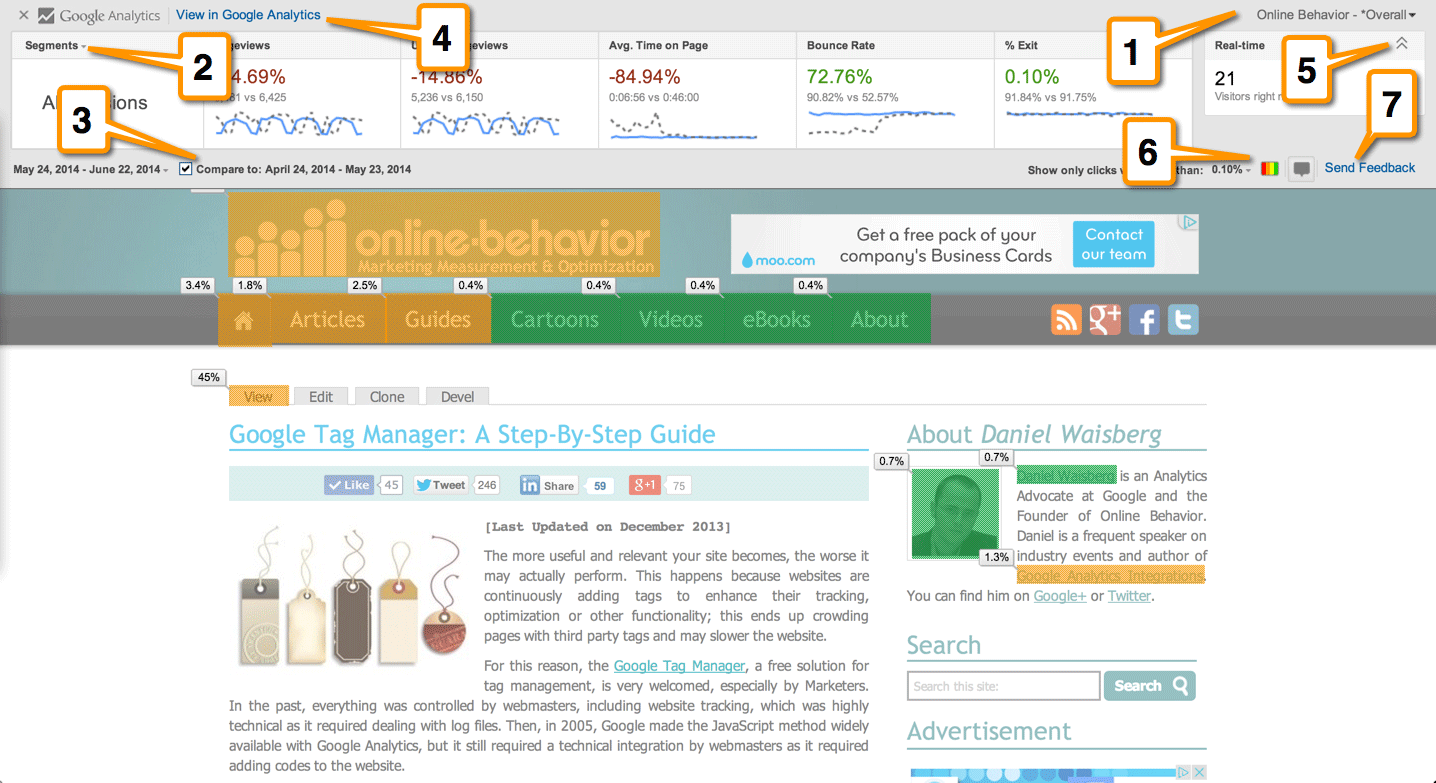
Your marketing team probably already knows about Google Analytics, but little do many know that you can also use it to make informed, calculated decisions for building your (software) product.
So we wanted to explore ways you can use Google Analytics, and how you can use it for your product development:
💻 Ways to use Google Analytics to build your product
Note: You’ll need to set up tracking ID’s, separate from your marketing team’s. This keeps everything tidier - you won’t have to fight for custom variables to your reports and metrics!
🔍 Examine behaviour with Behaviour Flow
Find it in: Behaviour > Behaviour Flow

Imagine you could be right next to your user and follow along how they interact with your product. This is what Google Analytics’ Behaviour Flow allows you to do - without having to be there for each and every one of your users.
This report shows you how many users flow from one page to another, and which exact pages they go to, and which pages they drop off from visually with this diagram. This is great for finding trends on your website/platform, i.e. 40% of users go from Page A to Page B / most users who visit Page C skips Page D and goes straight to E (so maybe Page E isn’t needed!).
This should help you see your user’s paths of behaviour and whether what you had in mind when you designed it is most efficient for them. If you have several pages that are similar and have the same objectives, consider using Content Groupings in Google Analytics. It lets you group pages which allows you to get more data back without it being too overwhelming.
🖱 See what users click on with In Page Reports
Find it in: Chrome Extension > Page Analytics by Google
It’s normal for your website or platform pages to have multiple links and call to actions! But the important part is knowing WHAT they do click on.
Say you have a page that showcases a variety of products, with their own images and buttons to “View More”. You can track which products your users are clicking on from that initial page, whether they click on the images more or the buttons, and even what they click on the navigation bar from that page.
Note: This only works when using Enhanced Link Attribution. Once you set that up, you’ll need Google’s Page Analytics Chrome Extension and then go to which page you want to track to see how often each and every link is clicked.
For more data on your user’s behaviour on each page, you could also use Hotjar to see a heatmap of your pages, to see where users are clicking on - be it links or not links! This helps you see that if i.e. you have an unclickable image that users seem to like to click on - make it a relevant link!
📲 Make responsive design justified with Mobile Overview
Find it in: Audience > Mobile > Overview

Depending on your product/platform, you can decide on which views (Mobile/Desktop/even Tablet!) to focus on designing on by seeing which device your users visit your website on most.
From here, you could dive even deeper with a secondary dimension to find exactly which devices your users are visiting on, if your desktop users are going to specific pages that are different from your mobile users, if they’re completing “tasks” (Google Analytics Goals).
This should help you in the design and test phases of your product/platform!
🌟 Find popular features with All Pages
Find it in: Behaviour > Site Content > All Pages

You don’t need to guess the features your users are using most - Google Anaytics can also track that!
Google Analytics gives us data and rankings on which features / pages your users are landing on most. It shows you how many users, unique users, average time they spend there, how many “bounce” (leave within only a few seconds), and more.
You can use this to first analyze their usual behaviour and later on see if adding a new functionality would change their behaviours. And like in Behaviour Flow, you can make use of content grouping to organize relevant features/pages. You’ll be able to see this in custom report to gather the data!
🏃🏻♂️ Identify where users leave with Exit Pages
Find it in: Behavior > Site Content > Exit Pages

It’s important to see where and when your users leave your pages/platform, it could help you find points of frustration or closure, or maybe even indication that your users did what they needed to on your product.
You can use this data in a few ways:
If your users are exiting on pages for resources/support: This could indicate that users need help, are getting stuck or giving up!
If your users are leaving in the middle of a process (without getting to a success page i.e. a thank you page after a form!): This should tell you to see if you could make the process a lot simpler for your users!
If your users are leaving from a success page: The best scenario! This could say that your users have successfully used your product and have left / find ways to make them use your product more!
It’s important to note that your users NEED an exit page at some point. You can’t have them use your product forever haha!
🧪 A/B (even C/D/E) test with Experiments
Find it in: Behavior > Experiments > Create Experiment

When you’re thinking about better ways of doing, formatting, layouting, etc. things, it’s best to back it up with data from your actual users! Another magic that Google Analytics has is their Content Experiments, which allows you to A/B different aspects on your page/platform.
Say you think a green button on “Buy Now” would work better than using your branding color red. You’ll need to clone the exact same page and change the color of the button on the new page. From there, Create an Experiment. It’ll ask for a name, your goal (i.e. more button clicks) and it will help you generate a required code snippet. You place it on the original duplicated page, and you are ready to go!
After some time (give it a few weeks!) you can check back to your report and see which button is encouraging more clicks - and implement it! If there’s any time you even want to experiment even more aspects, say even an orange and yellow button, you can do that as well!
🗄 Segment your data
In every report, you can segment your data through various parameters, i.e. geography, devices, age, date ranges, etc. as not all users and sessions are “equal” per se (Some may have just found you a week ago! Their behaviours could vary from someone who found you a year ago.).
You can create these custom reports and save them so you can quickly look back at data that matters to you!
Google Analytics is a great tool for not just marketing teams, but also and even especially product teams who can use data to make decisions and improve their products.
The best part? Google Analytics is a freemium service, so you CAN use it for free - with only a few limitations!
🎧 Listen to the episode on your favorite podcast channels
Spotify | Apple Podcasts | Google Podcasts | Other channels
💥 Bonus:
Prakash’s top tips for entrepreneurs
⏰ Things that matter take time. It’s almost always longer than you think - and that’s okay.
🗺 In developing your product, map out your customer journey before doing anything else.
📉 Be data-driven, and apply it everywhere. Don’t fly blind.
🎙 Stay in touch:
That’s it for now! I’ll see you guys next week for another episode release ;)